
For an example of calculating the regression line, let's use the tiny dataset from 9/18:
| x | y |
| 5 | 6 |
| 1 | 0 |
| 10 | 8 |
| 4 | 6 |
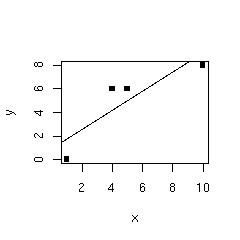
(1) Plot the data, checking whether a linear fit makes sense
:
(2a) Calculate the regression line: from summary statistics by converting to Z-scores or using the "hand formulas"
We end up with yhat = 0.95 + 0.809 x (that "yhat" should be a "y" with a "^" over it, to show that it's the predicted value).
(2b) Plot the regression line with the data.
(3) Now calculate the residuals.
| x | y | yhat = 0.95 + 0.809 x | e = y - yhat |
| 5 | 6 | 5.0 | 1.0 |
| 1 | 0 | 1.8 | -1.8 |
| 10 | 8 | 9.0 | -1.0 |
| 4 | 6 | 4.2 | 1.8 |
and plot them:
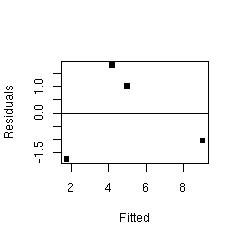
We would like there to be no pattern.There might be an upside-down "U" pattern here, which suggests that a fitting a line might not have been best. With just four observations, however, it's hard to know.